Versatile Webalizer - Log Analyzer And Traffic Widget Too!
 11/02/2012 02:05:00 PM
 Jsc Jwhat Jerome Christopher
, Posted in
DIY
,
Linux
,
Log Analyzers
,
Puppy Linux
,
Site Stats
,
Sqlhtm Tools
,
Tips'nTricks
,
Traffic Widgets
,
Web Tools
,
Website Traffic
,
Website Traffic Widgets
Jsc Jwhat Jerome Christopher
, Posted in
DIY
,
Linux
,
Log Analyzers
,
Puppy Linux
,
Site Stats
,
Sqlhtm Tools
,
Tips'nTricks
,
Traffic Widgets
,
Web Tools
,
Website Traffic
,
Website Traffic Widgets
Boost Your Holiday Spirits With A Bright And Colorful DIY Webalizer Widget!
There are probably a hundred million sitestat widgets out there, each of them unique and useful to at least some!
Got Webalizer on cPanel?
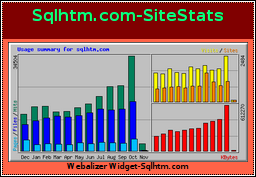
If you have Webalizer installed and configured from cPanel on your webserver, here is an unbelievably easy way to create a sitestats widget for your website. Actually our widget is just a wrapper to the usage image from the main page of the Webalizer tool! This beautiful image displays the "Pages-Files-PageViews" count on the LHS of the image with aqua, blue and dark green colors. On the top right of the image, it displays the "Visits-Sites" count with yellow and orange colors and on the bottom right, it displays the "Bandwidth" in KBs with red color. The stats are displayed with a nice monthly bar chart that spans a complete year! Absolutely cool!
The Webalizer widget can be custom-colored to match your site
Ready to create one for yourself? Here is what you do
1.Get webalizer working from cPanel
It is assumed that you already have Webalizer installed on your cPanel. If not, have your hosting provider authorize installation and configuration of Webalizer from your cPanel and wait till you have enough data to display. We can't show an empty chart! ;)
2.Create a cronjob to copy the usage image to your webroot
Login to your account, create a cronjob to copy the usage.png file from Webalizer directory to public_html. Let it run a few minutes after every Webalizer run. The following runs it at 13.45 everyday after my default scheduled Webalizer run at 1.30pm. This will refresh it once every day.
45 13 * * * cp /home/cpanel-accountname/tmp/webalizer/usage.png /home/cpanel-accountname/public_html
Change the hosting account name [in red] to match yours. Change cp to /bin/cp or where ever it is kept if needed. You can put it in a nice script and call it from the cronjob too!
3.Create the wrapper for the widget:
Okay, so we have solved the main problem of how to get the data for our widget displayed with a good chart. Now we just need to change the width parameter in the <img> tag to fit it in our sidebar. Make a wrapper for our widget like this.
<div style="color:black;background-color:silver; width: 250px;
margin:0 auto;border:1px dotted;text-align:center;">
<div style="height:30px;color:springgreen;font-weight:bold;background-color:black;padding:3px;">Sqlhtm.com-SiteStats</div>
<div style="text-align:center;padding:3px;">
<a href="usage.png" target="_blank">
<img src="usage.png" width="240px" alt="WebalizerSiteStats"></a>
<a style="color:black;font-size:6pt;">Webalizer Widget-Sqlhtm.com</a></div></div>
4.Modify the code above to match your needs
Copy the code to your page and change
a) The site name [in green color] in the heading on top of the code block
b) The font-colors and the background colors [in green color] in the first and the second <divs> of the code block as needed. [The code block, as it is, makes a widget looking like the first of the four-widget image above].
NOTE: Location of the image file
We are using relative path names for the image file in the <a> and <img> tags. They point to the usage.png [in green color] at webroot[public_html]. Change the cronjob to copy it to the public_html/images directory and also change the above 2 tags here to point to it to keep in line with best practices.
Test the widget width and make sure everything works
Put this code at the appropriate location on your page such as the LHS or RHS sidebar. Change the width [in green color] to match your requirements. Test the widget by refreshing it manually if you can or wait till the next scheduled webalizer run completes. The current month bar may seem to grow slowly if you have low values. The horizontal dividers carve out the chart on the x-axis in equal chunks so that values for the other bars can be guessed accurately.
Limitations
The chart displays only the highest values in numbers for pageviews, visits and KBs for the whole 12-month period on the left and right sides of the chart. The numbers won't change if the current values don't exceed the all-time yearly high values. So this widget is only useful as a graphical summary of the whole year.
Another drawback is that this widget is not live. It is only as new as your last webalizer run! A page refresh updates it to the last webalizer run.
Log analyzer as traffic widget? Versatile Webalizer!
Are you using webalizer as a log analyzer only? Let it be your website traffic widget too! I love this simple, easy, bright and colorful DIY Webalizer sitestat widget, don't you?